Overview
A Recruitment dashboard helps businesses monitor hiring performance using real-time metrics such as time to hire, cost per hire, quality of hire, source of hire, and offer acceptance rate. By tracking these key performance indicators (KPIs), companies can make data-driven hiring decisions, reduce recruitment costs, improve candidate quality, and build a more efficient hiring process. Whether you’re a startup or an established business, a well-designed recruitment dashboard provides valuable insights that lead to smarter recruitment strategies.
How to Build a Recruitment Dashboard for Your Business
Hiring without data is like driving without a dashboard—you might eventually reach your destination, but you’ll waste time, money, and opportunities along the way.
As businesses become more competitive in 2026, HR teams can no longer rely on intuition alone. Companies need measurable insights that reveal what’s working, what isn’t, and where improvements can be made.
That’s where a Recruitment dashboard becomes invaluable.
If you’ve been wondering how to build a recruitment dashboard for your business, this guide explains everything you need to know, from selecting the right metrics to using analytics that improve hiring decisions.
What Is a Recruitment Dashboard?
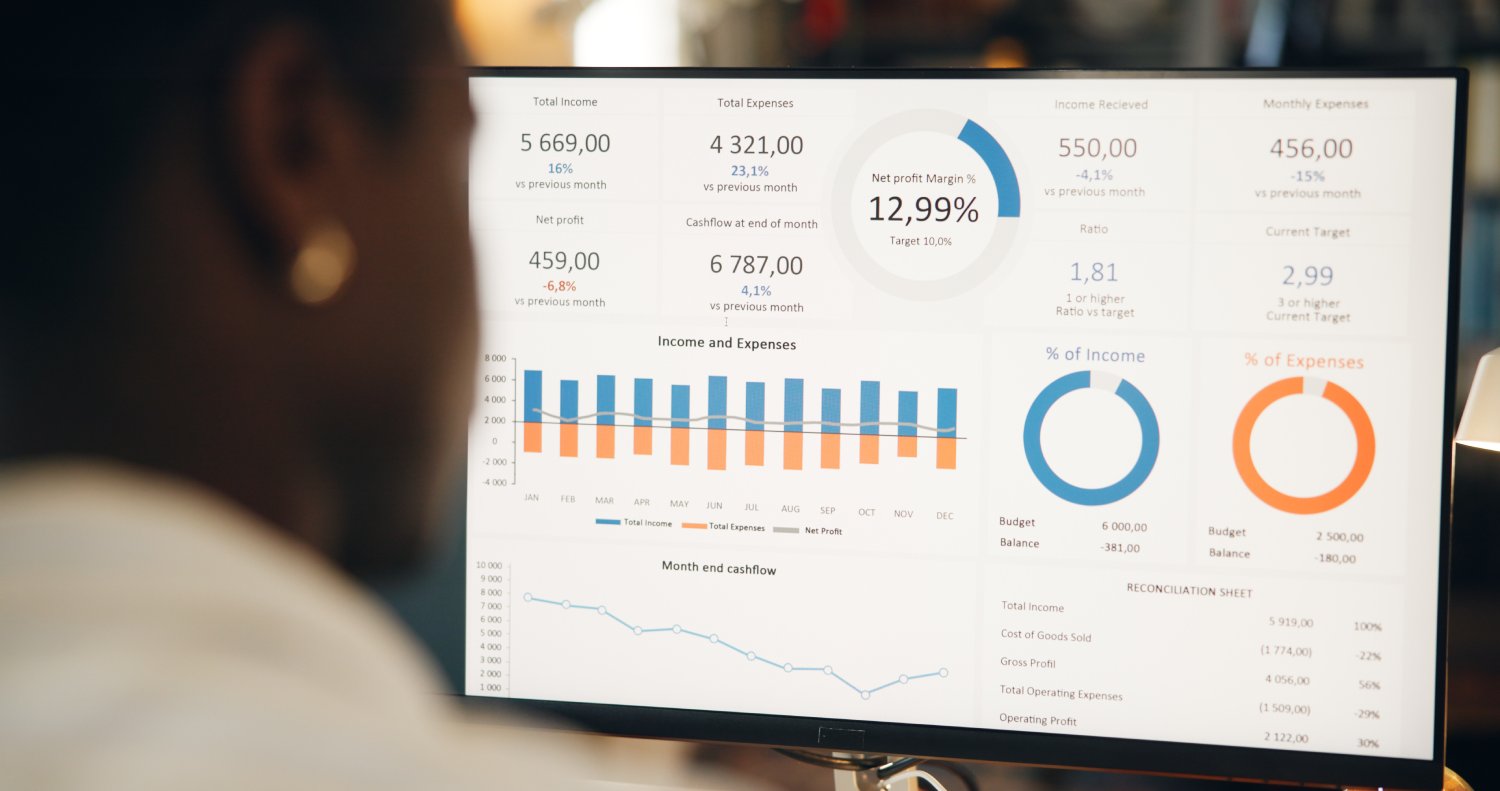
A Recruitment dashboard is a visual reporting tool that tracks important recruitment metrics and KPIs in one centralized location. Instead of manually reviewing spreadsheets or multiple reports, recruiters and business leaders can instantly monitor hiring performance.
A recruitment dashboard typically displays:
- Time To Hire
- Time To Fill
- Cost Per Hire
- Quality Of Hire
- Source Of Hire
- Offer Acceptance Rate
- Candidate Pipeline
- Recruitment ROI
Think of it as the control center for your hiring process.
Why Every Business Needs a Recruitment Dashboard
Many businesses struggle because they don’t know where their recruitment process is slowing down.
Without measurable data, companies often experience:
- Long Hiring Cycles
- Higher Recruitment Costs
- Poor Candidate Quality
- Low Offer Acceptance Rates
- High Employee Turnover
A data-driven recruitment dashboard provides visibility into every stage of hiring, helping HR teams identify bottlenecks before they become expensive problems.
Benefits of Using a Recruitment Dashboard
A recruitment dashboard delivers advantages beyond simple reporting.
Better Hiring Decisions
Instead of relying on assumptions, managers can make evidence-based hiring decisions using recruitment analytics.
Faster Recruitment
Tracking hiring speed helps reduce delays and improve recruiter efficiency.
Lower Hiring Costs
Companies can identify expensive hiring channels and invest more in sources that consistently produce qualified candidates.
Improved Candidate Experience
Monitoring communication times and recruitment stages helps businesses provide a smoother hiring journey.
Better Workforce Planning
Historical recruitment data makes forecasting future hiring needs significantly easier.
What Should Be Included in a Recruitment Dashboard?
If you’re asking what should be included in a recruitment dashboard, these are the essential metrics every organization should monitor.
Time to Hire
Measures how long it takes from first candidate contact until the candidate accepts the offer.
A shorter time to hire often means:
- Better Candidate Experience
- Lower Recruitment Costs
- Less Risk Of Losing Top Talent
Time to Fill
Measures the total number of days between opening a job position and filling it.
Unlike time to hire, this includes internal approval delays and sourcing activities.
Cost Per Hire
One of the most important Recruitment reporting metrics, cost per hire measures the total recruitment expense divided by the number of hires.
This includes:
- Advertising Costs
- Recruitment Agency Fees
- Recruiter Salaries
- Job Board Expenses
- Interview Costs
- Technology Costs
Understanding cost per hire helps companies optimize recruitment budgets.
Quality of Hire
Quality of hire measures how successful new employees become after joining the company.
Common indicators include:
- Performance Ratings
- Retention Rate
- Manager Satisfaction
- Employee Productivity
This metric directly connects recruitment with business performance.
Source of Hire
Knowing where successful candidates come from allows companies to invest in the highest-performing recruitment channels.
Examples include:
- JobStreet
- Employee Referrals
- Career Websites
- Recruitment Agencies
- Social Media
Offer Acceptance Rate
This measures how many candidates accept your job offers.
A low acceptance rate may indicate:
- Salary Issues
- Slow Hiring Process
- Poor Candidate Experience
- Strong Competition
Recruitment ROI
Recruitment ROI compares hiring investments against business outcomes.
Companies with strong recruitment ROI often experience:
- Lower Turnover
- Higher Productivity
- Reduced Hiring Costs
- Better Employee Performance
How to Build a Recruitment Dashboard for Your Business
Building an effective dashboard doesn’t require complex software. It starts with choosing meaningful metrics.
Step 1: Define Your Hiring Goals
Identify what success looks like.
Examples include:
- Reduce Time To Hire
- Lower Cost Per Hire
- Improve Candidate Quality
- Increase Offer Acceptance Rate
Step 2: Choose Recruitment KPIs Every Business Should Monitor
Select only the metrics that directly support your hiring objectives.
The Recruitment metrics that matter most typically include:
- Time To Hire
- Cost Per Hire
- Quality Of Hire
- Source Of Hire
- Time To Fill
- Recruitment ROI
Step 3: Collect Reliable Recruitment Data
Gather information from:
- Applicant Tracking Systems (ATS)
- HR Software
- Recruitment Platforms
- Interview Scorecards
- Performance Reviews
Clean, accurate data produces more reliable insights.
Step 4: Visualize the Data
Your dashboard should be easy to understand.
Include:
- Charts
- Trend Lines
- Bar Graphs
- Scorecards
- Monthly Comparisons
- Recruitment Funnel Visualizations
Clear visuals help executives quickly understand hiring performance.
Step 5: Review and Improve
Recruitment dashboards should evolve alongside your hiring goals.
Review data regularly to identify trends and adjust recruitment strategies accordingly.
Recruitment Analytics Dashboard Explained
Many people confuse recruitment metrics with recruitment analytics.
Recruitment metrics are individual measurements like cost per hire or time to hire.
Recruitment analytics goes one step further by identifying patterns, predicting hiring outcomes, and helping businesses make strategic decisions.
For example:
Instead of simply knowing that time to hire increased, analytics explains why it increased.
This is why many companies now invest in Recruitment analytics for better hiring.
Recruitment Dashboard Examples
A typical dashboard might include:
- Hiring Pipeline
- Open Positions
- Applications Received
- Interview Conversion Rate
- Offer Acceptance Rate
- Quality Of Hire
- Recruitment ROI
- Employee Retention After Six Months
These Talent acquisition dashboard examples allow HR leaders to monitor recruitment performance at a glance.
Recruitment Dashboard for Small Businesses
Small businesses often assume dashboards are only for large corporations.
In reality, a Recruitment dashboard for small businesses provides even greater value because hiring budgets are limited.
Simple dashboards built using Excel, Google Sheets, or business intelligence tools can dramatically improve recruitment decisions.
Recruitment Dashboard for Growing Companies
As organizations expand, hiring becomes more complex.
A Recruitment dashboard for growing companies helps leaders:
- Forecast Hiring Needs
- Track Recruitment Capacity
- Allocate Recruitment Budgets
- Measure Hiring Performance
- Improve Recruitment Efficiency
Recruitment Dashboard Software Features
Modern recruitment platforms often include built-in dashboards.
Useful features include:
- Real-Time Reporting
- Automated KPI Tracking
- Recruitment Funnel Analysis
- Candidate Source Tracking
- Custom Reports
- Performance Dashboards
- Recruitment Forecasting
Choose software that integrates with your existing HR systems.
Hiring Dashboard Best Practices
To maximize value:
- Focus On Actionable Metrics
- Review Dashboards Weekly
- Compare Historical Performance
- Share Reports With Hiring Managers
- Automate Data Collection
- Continuously Improve Recruitment Processes
These Recruitment dashboard best practices ensure your dashboard remains useful over time.
How Hire Manila Helps Businesses Improve Recruitment Performance
Creating a dashboard is only one part of successful hiring.
Businesses also need experienced recruitment professionals who understand how to interpret data and turn insights into results.
Hire Manila provides comprehensive recruitment solutions for businesses across Metro Manila and Cebu, helping companies improve hiring performance through data-driven recruitment strategies, workforce planning, recruitment analytics, talent acquisition support, and recruitment process optimization.
Whether you’re building your first recruitment dashboard or scaling recruitment across multiple departments, Hire Manila can help you create measurable hiring success while reducing recruitment costs and improving candidate quality.
Conclusion
A recruitment dashboard is no longer a luxury—it’s an essential business tool.
By tracking meaningful KPIs, monitoring recruitment analytics, and continuously improving hiring performance, businesses can reduce hiring costs, improve candidate quality, and make smarter workforce decisions.
Whether you’re a startup, SME, or enterprise, learning how to build a recruitment dashboard for your business is one of the most valuable investments you can make for long-term growth.
With the right metrics, reliable data, and expert recruitment support from Hire Manila in Metro Manila and Cebu, your organization can build a hiring process that is faster, more efficient, and driven by measurable results.
Frequently Asked Questions
1. What is a recruitment dashboard?
A recruitment dashboard is a centralized reporting tool that displays hiring metrics and KPIs to help businesses monitor recruitment performance.
2. Why is a recruitment dashboard important?
It provides real-time insights that help businesses make informed hiring decisions, reduce costs, and improve recruitment efficiency.
3. What metrics should be included in a recruitment dashboard?
Include Time to Hire, Time to Fill, Cost per Hire, Quality of Hire, Source of Hire, Offer Acceptance Rate, Recruitment ROI, and Candidate Pipeline metrics.
4. How do you build a recruitment dashboard?
Define hiring goals, identify KPIs, collect reliable recruitment data, visualize the information, and regularly review performance.
5. What is the difference between recruitment metrics and recruitment analytics?
Recruitment metrics measure hiring performance, while recruitment analytics analyzes those metrics to identify trends and improve decision-making.
6. How can a recruitment dashboard improve hiring decisions?
It highlights recruitment bottlenecks, tracks hiring success, and provides data that supports strategic hiring improvements.
7. What is time to hire?
Time to hire measures the number of days between first contacting a candidate and accepting a job offer.
8. What is cost per hire?
Cost per hire is the total recruitment expense divided by the number of employees hired.
9. What is quality of hire?
Quality of hire measures how successful new employees perform after joining the organization.
10. How often should recruitment dashboards be updated?
Most businesses benefit from updating dashboards weekly or monthly, depending on hiring activity.
11. What tools can businesses use to create a recruitment dashboard?
Businesses commonly use Applicant Tracking Systems (ATS), HR software, Google Looker Studio, Microsoft Power BI, Tableau, Excel, and Google Sheets.
12. Can small businesses benefit from recruitment dashboards?
Yes. Even simple dashboards help small businesses monitor recruitment performance and make smarter hiring decisions.
13. How does recruitment data help reduce hiring costs?
Recruitment data identifies inefficient hiring channels, shortens hiring cycles, and improves recruitment ROI.
14. What recruitment KPIs should growing businesses track?
Growing businesses should monitor Time to Hire, Cost per Hire, Quality of Hire, Offer Acceptance Rate, Source of Hire, and Recruitment ROI.
15. How can Hire Manila help businesses improve recruitment performance?
Hire Manila provides recruitment solutions, recruitment analytics, hiring strategy, and talent acquisition services for businesses throughout Metro Manila and Cebu.
16. What is the best recruitment dashboard for HR teams?
The best dashboard is one that tracks your organization’s key hiring KPIs, offers real-time reporting, and integrates with your HR systems.
17. What recruitment KPIs matter most?
Time to Hire, Time to Fill, Cost per Hire, Quality of Hire, Source of Hire, Offer Acceptance Rate, and Recruitment ROI are among the most valuable KPIs.
18. How do you measure recruitment success?
Measure recruitment success using hiring speed, hiring quality, candidate satisfaction, retention rates, recruitment ROI, and overall business outcomes.
19. How can recruitment analytics reduce hiring costs?
Recruitment analytics identifies inefficient recruitment activities, improves sourcing strategies, and enables better budget allocation.
20. What is the difference between a hiring dashboard and a recruitment dashboard?
A hiring dashboard generally focuses on active hiring activity, while a recruitment dashboard provides broader recruitment analytics, long-term performance tracking, and strategic workforce insights.